Measurement: Demand Response Guide
Measurement enables ongoing tracking of demand-side program impacts through transparent, revenue-grade measurement of projects and events. Measurement delivers continuous reporting on the performance of deployed demand-side assets during program execution.
Measurement is available across both project and event-based program designs, each with an associated set of features tailored to its use case.
Event-Based Programs:
- Portfolio Level: Summarizes program-level results and provides insights into individual event performance.
- Event Level: Provides a summary across all participants at the aggregate event load performance level.
- Participant Level: Details individual participant performance across all events and at the individual event level.
Event-Based Measurement
Demand Response | Distributed Energy Resources
Measurement for event-based programs provides a comprehensive overview of program-level participation and performance. Users can review metrics such as total participants, event frequency, average hourly load reduction, and peak demand impact. Event-based Measurement is divided into five key sections, all of which update dynamically as filters are applied:
- Program-Wide Hourly Performance
- Event History
- View Performance By
- Program-Wide Snapback Analysis
- Performance Fatigue Tracking
-
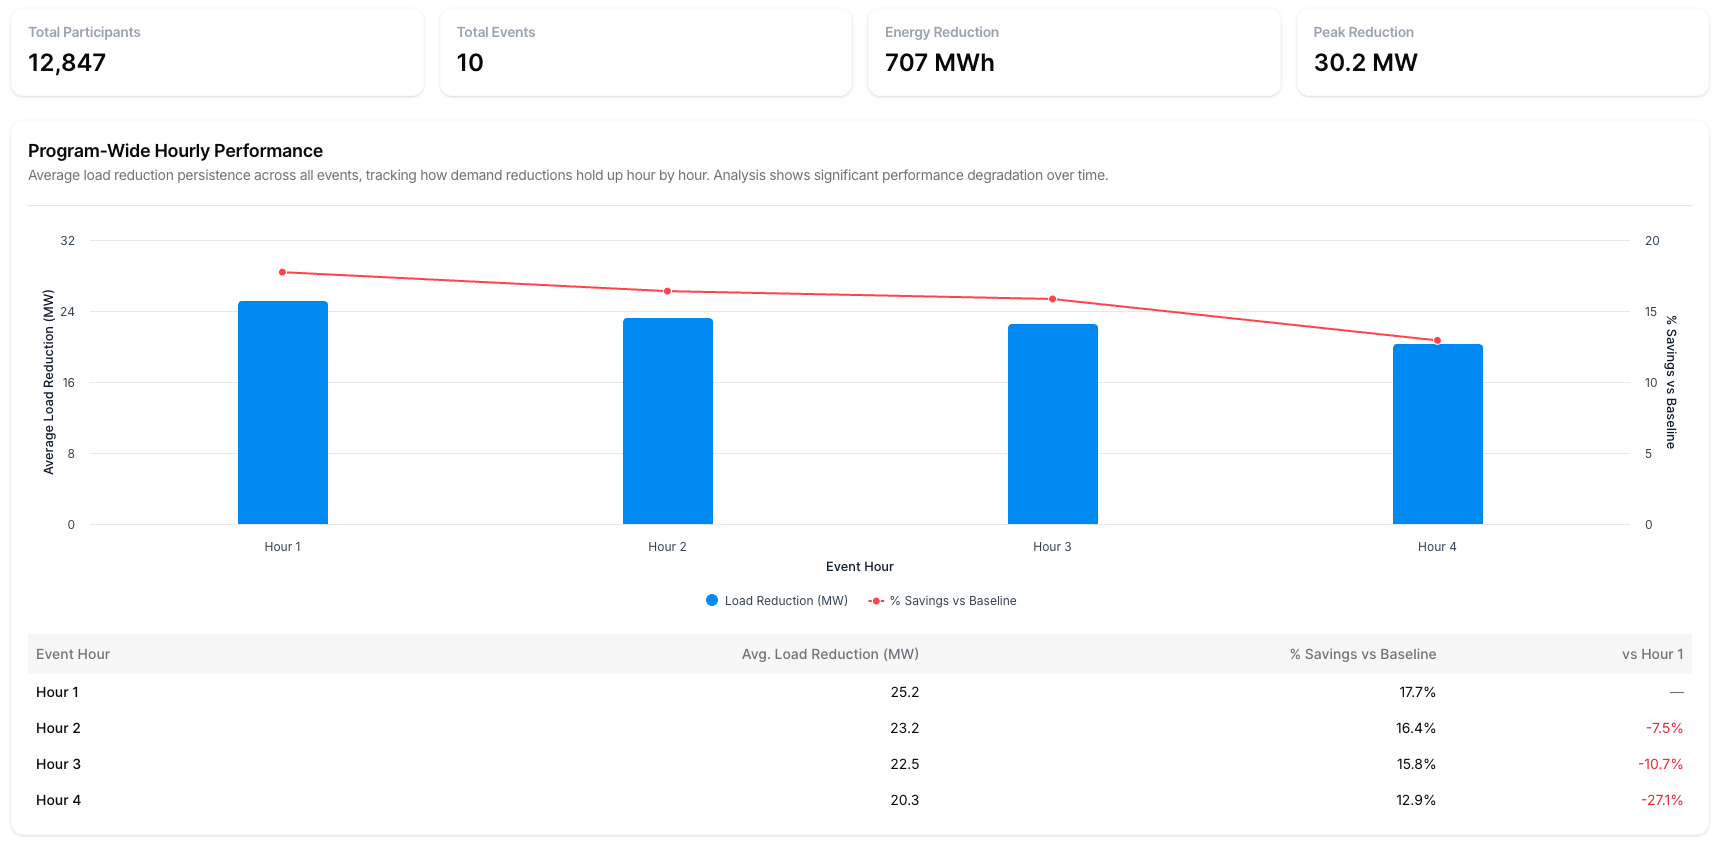
Program-Wide Hourly Performance
This section presents hourly averages of load reduction across the entire program. Percent savings vs. baseline shows the percentage of baseline usage the savings represent, illustrating program trends over time.
-
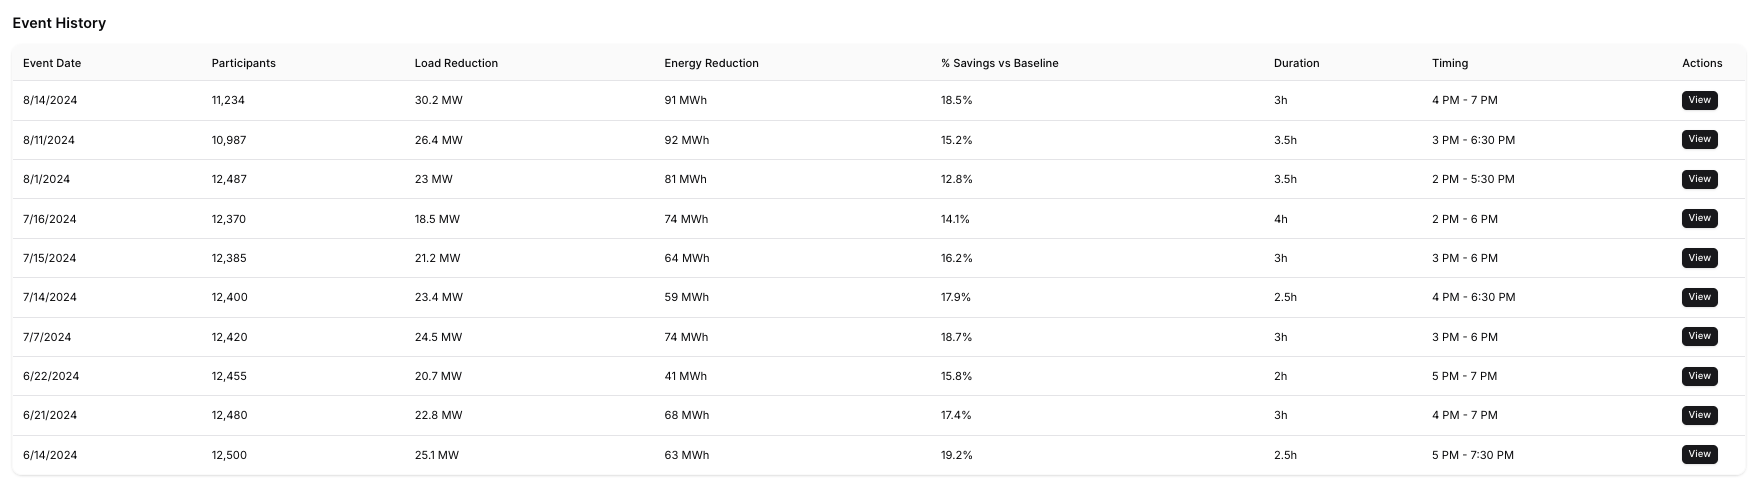
Event History
The Event History table presents key data for all event dates, including the total participants, load reduction, event window, and duration. Users can drilldown to individual event performance details by clicking ‘View’ in a specific event row. This event-level drilldown provides baseline and observed load at the hourly level surrounding the event window.
-
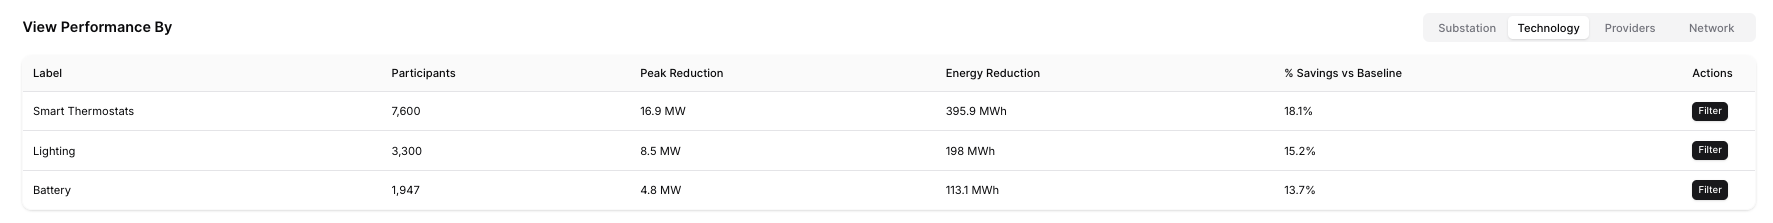
View Performance By
This section enables detailed analysis of program performance across multiple dimensions, using key metrics such as total participation, peak load reduction, and percentage savings relative to the baseline. Users can explore the dynamic table to analyze performance across categories such as substation, technology, providers, and network, gaining granular insights. Note that the categories available may vary depending on the available data inputs. Users may also select 'Filter' on any specific row (e.g., Technology > Smart Thermostats) to apply that category across the entire program-level results.
-
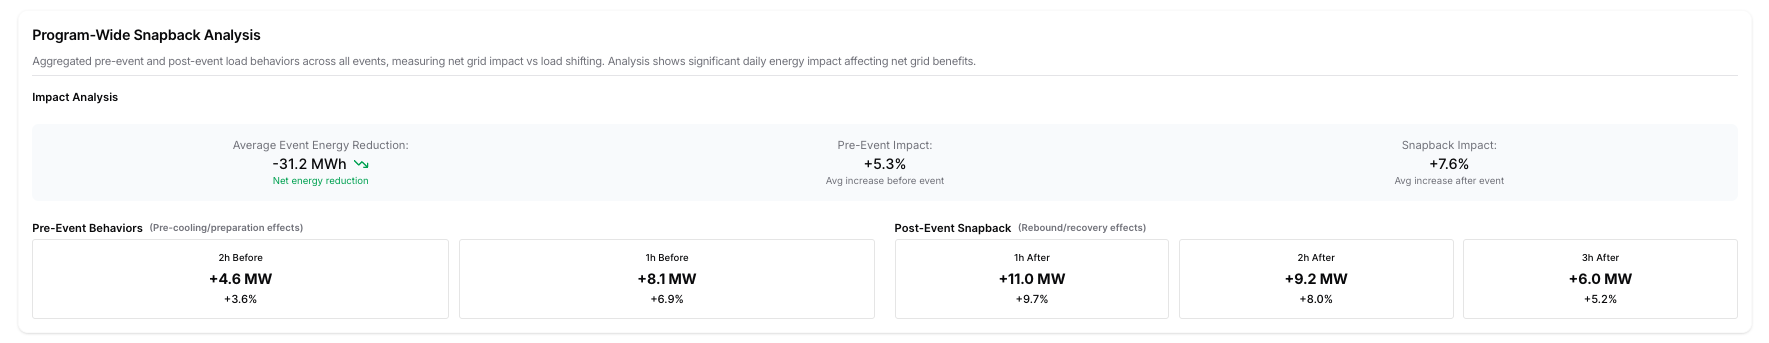
Program-Wide Snapback Analysis
This section visualizes aggregated load behavior immediately preceding and following an event. Users can analyze this section to understand the full context of program impacts, including hours surrounding the event windows. Pre- and post-event usage patterns provide useful insights into load-shifting impacts and net grid benefits.
-
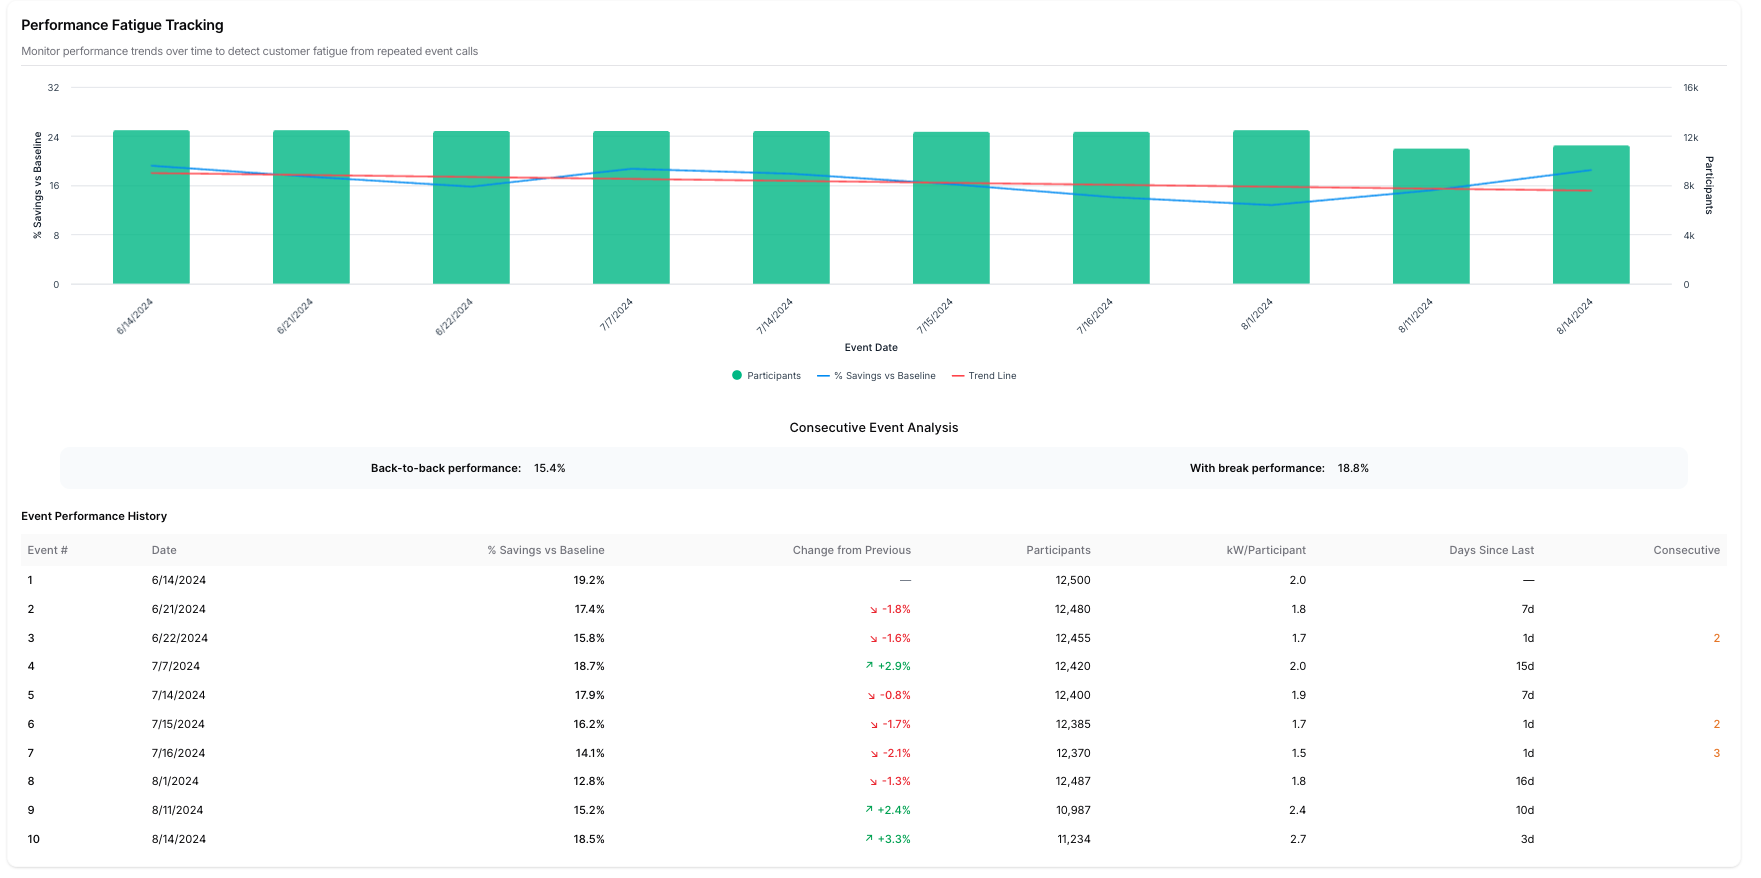
Performance Fatigue Tracking
The Performance Fatigue Tracking section depicts performance trends over time to illustrate customer fatigue from repeated event calls. The Consecutive Event Analysis in this section compares Percent Savings vs. Baseline for back-to-back events versus events with breaks in between. The Event Performance History table provides the Change from the previous performance over time, across all events, to highlight the fatigue patterns associated with consecutive events.